A method of signal calculation that eliminates read distribution bias and prevents underestimation of reactivity.
Paste or upload your stops counts below and click the Submit button. To get more information on the meaning of the options, click the symbol. You can test the server using our example data.
Upload input file with counts
Custom column number
P-value
or Paste counts
A method of signal calculation that eliminates read distribution bias and prevent underestimation of reactivity.
Normalized reactivities calculated with rnaNORM
Stops correlation after normalization
ERROR: Not enough positions to calculate reactivity. Choose another transcript.
rnaNORM requires a minimum of 20 positions per transcript to start the normalization process. At least 20% of those should have both control and treated counts higher than zero. These numbers make it possible to determine the appropriate distributions upon which normalization is based.
Check Help for more information.
About rnaNORM
rnaNORM is a method of signal calculation that eliminates read distribution bias and prevent underestimation of reactivity.
Check the 'How rnaNORM works?' section for more info. There is also a command-line version available.
How rnaNORM works?
-
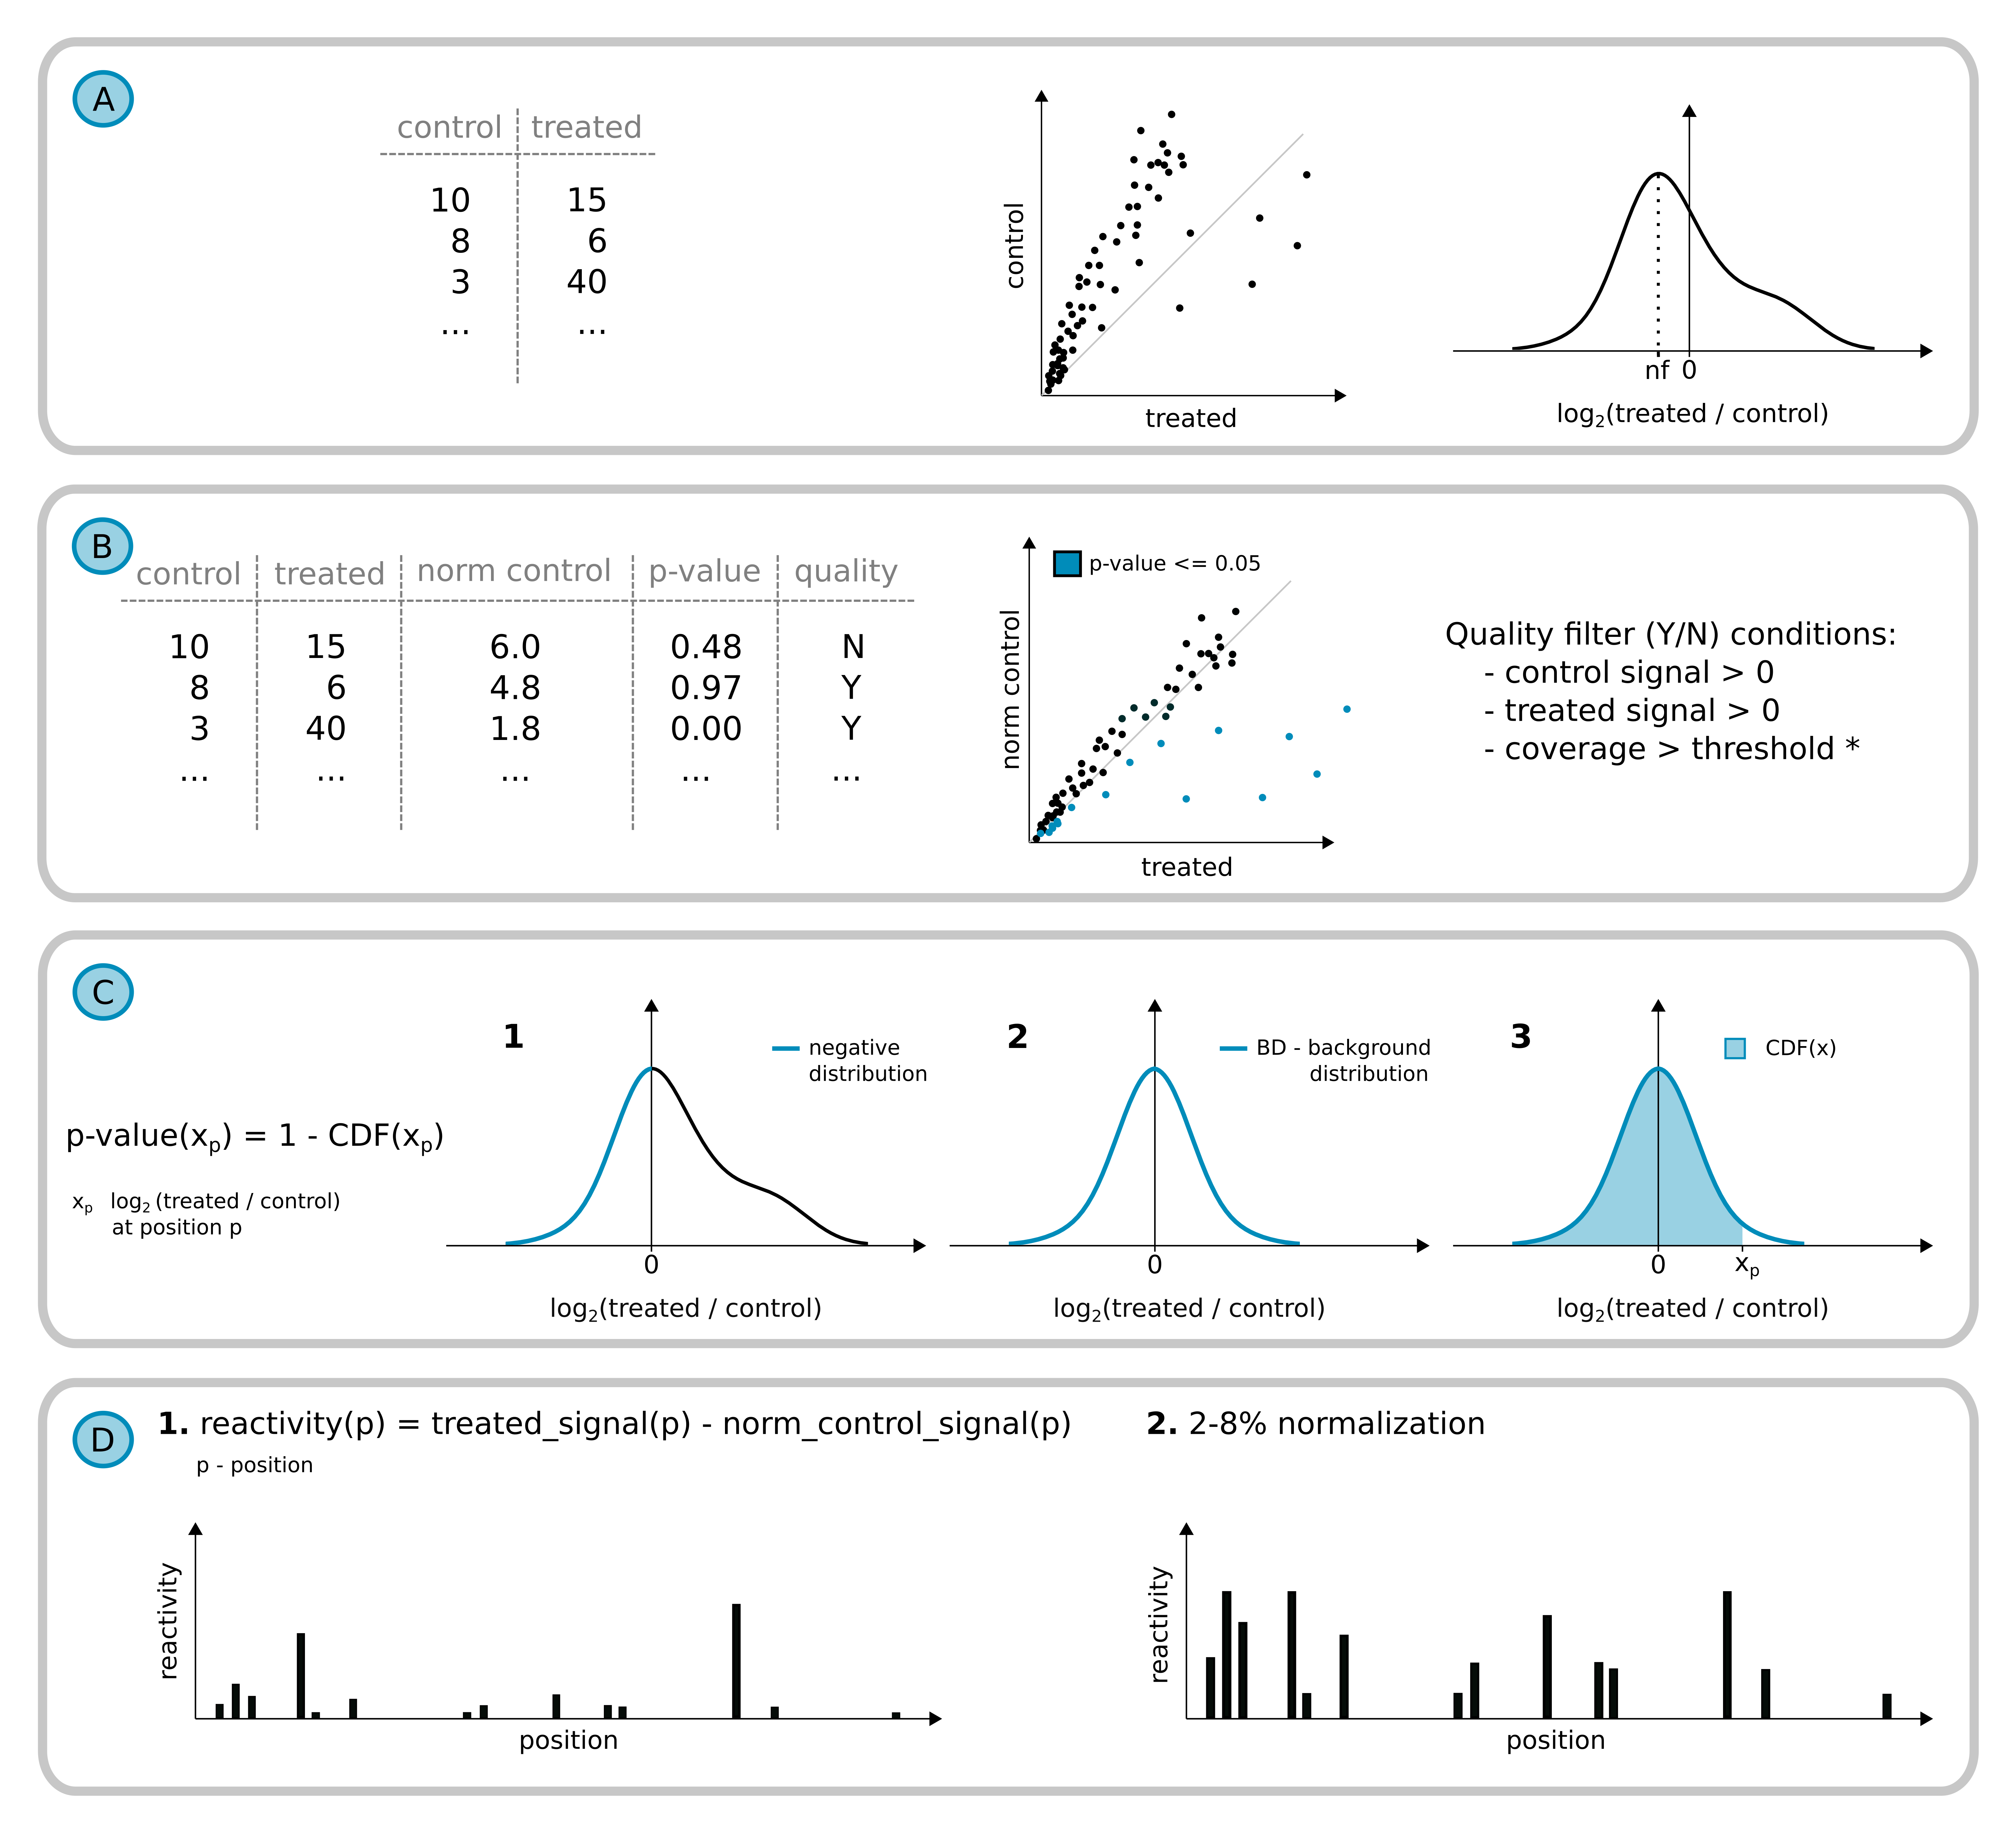
The distribution of log2 fold changes is used for density function estimation. It enables to calculate the value of fold change characteristic for background, which rnaNORM use as normalization factor (nf). In the background signal after correction, normalized control counts are an approximate value of counts in the treated sample. Only positions meeting the quality filtering criteria are used for further calculations.
-
Distribution of log2 fold changes is used for density function estimation. It enables to calculate the value of fold change characteristic for background, which next is used as normalization factor (nf). In the background signal after correction, normalized control counts are an approximate value of counts in the treated sample. Only positions meeting the quality filtering criteria are used for further calculations.
* Users can run the coverage filtering as part of the local for preparing the input data from alignment files.
-
P-value calculation steps:
-
The negative part of the log2 fold change distribution is extracted and mirrored on the right side.
-
Next, to the newly formed distribution, rnaNORM is fitting the gaussian distribution - creating the background distribution (BD).
-
rnaNORM is calculating the cumulative distribution function to estimate the p-value for each position of the transcript. CDF is the probability that X will take a value less than or equal to x.
-
-
Transcript reactivity profile.
-
Normalized counts are used for reactivity calculation for each position by subtraction of normalized control signal from treated.
-
The final profile is scaled with 2-8% normalization (Deigan et al., 2009).
-
Input format
rnaNORM input file contains RT polymerase stops counts for both treated and control samples. The illustration below shows the RT stop identification.
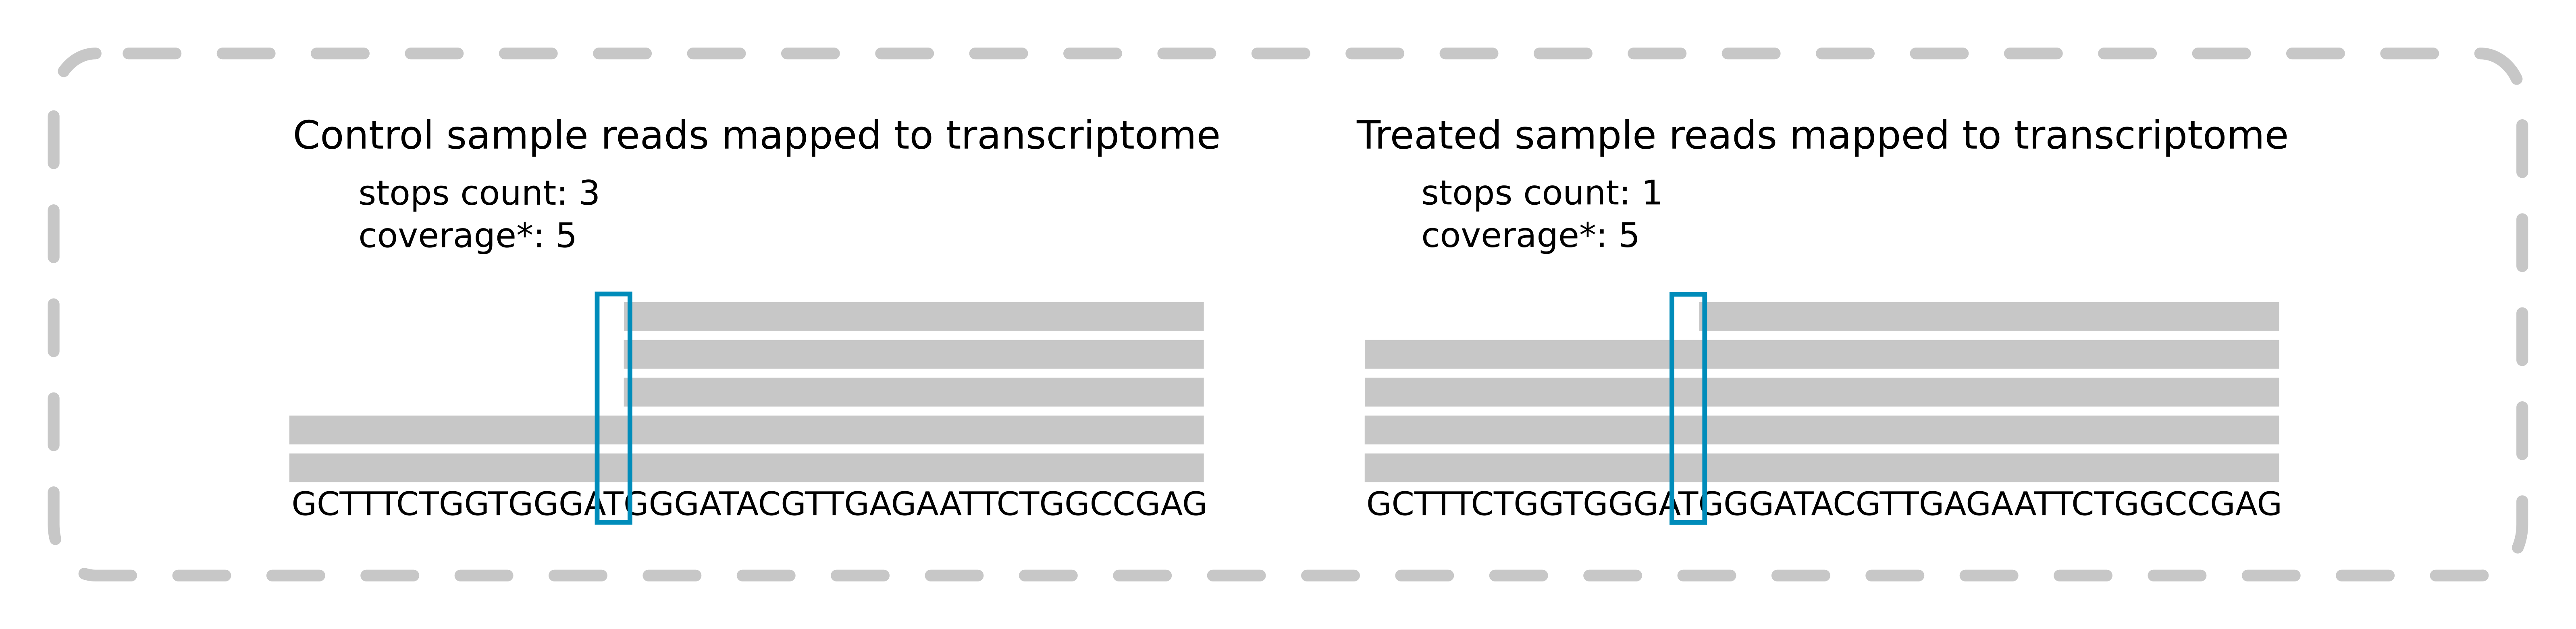
The position of the stop is the last nucleotide in a read mapped to a transcript. Coverage can be used as a filtering factor while using our script for counting RT stops from chemical probing experiments. It is available on GitHub. The input file is an indexed BAM file with reads aligned to the transcriptome.
The input file consists of four tab-delimited columns (default order):
-
Transcript ID
-
Position
-
Stops count in the control sample
-
Stops count in the treated sample
Users can also specify column order in the file using the column order panel (left side).
It is possible to upload multiple transcripts in one file.
Script for stops counting from chemical probing experiments is available on GitHub. The input file is an indexed BAM file with reads aligned to the transcriptome.
Output
The output page consists of five panels explained below:
-
'Select transcript ID' Users can choose the transcript from the drop-down list.
-
'Background consistency'
-
'Normalized reactivities calculated with rnaNORM' Barplot is showing the reactivity for each position in the transcript. The reactivities are grouped into four ranges: <0.6, 0.6-0.9, 0.9-1.2 and >1.2. Click and drag on the plot to zoom-in and double-click to zoom-out completely.
-
The table contains full information about the selected transcript. It consists of seven columns:
-
Position in transcript
-
Stops count in the treated sample (from input)
-
Stops count in the control sample (from input)
-
Normalized stops count in the control sample. Stops are normalized by incorporating the normalization factor (nf). Check the 'How rnaNORM works?' point B for more information.
-
Reactivity, calculated based on the normalized control stops. Check the 'How rnaNORM works?' point D for more information.
-
P-value indicates the probability of nucleotide at a given position being a part of the background, not statistically significant. Check the 'How rnaNORM works?' point C for more information.
-
Quality filter (Y - yes / N - no). Transcript positions that exceed the filtering step are those with stops count higher than zero (both control and treated samples), without any missing parameters, and with proper coverage value (when a local script is determining the stops counts).
Users can filter the resulting table. Filters are visible at the top of each column. The range filters should be set by sliders or typed as numbers with '...' as a separator. After filtering, the reactivity barplot will show only positions from the table.
-
-
'Stops correlation before and after normalization' Two scatterplots are representing counts correlation. Each dot refers to counts in both control and treated samples in a particular position in the transcript. Dots colors on the normalized plot(right) are representing the p-value. Users can filter them by the slider above or change the scale type from linear (default) to logarithmic using buttons.
Downloading the results
rnaNORM allows users to download results in two ways:
-
Download the currently selected transcript. Click the 'Download visible data' button above the result table. The name of the downloaded file will be the same as the transcript. The file is a comma-separated CSV format. If users performed any filtering on the table, the downloaded file would only contain rows that fulfill the filtering.
-
Download all transcripts from the current analysis. Click the 'Calculate all' button on top of the site and start the normalization of all transcripts since rnaNORM at the beginning normalize only selected transcript. After normalization, it will change its appearance to the green 'Download all' button. The file is a comma-separated CSV with the name 'data_xxxxxx.csv' where xxxxxx are the random characters (A-Z, a-z, 0-9).
Example data
The provided example data are transcripts from experiments:
-
BioProject: PRJNA216133; mod-seq; S. cerevisiae; Transcripts: RDN18-1, RDN25-1, SCR1
-
RMDB: 5SRRNA_1M7_0001; SHAPE-seq; E. coli; 5S rRNA in vitro
-
RMDB: 5SRRNA_1M7_00071; SHAPE-seq; E. coli; 5S rRNA in vivo